Another look at market breadth

Breadth measures how many stocks are participating in a market move and it's important to examine it from time to time. 🔍

It's been over a month since I last looked at market breadth and now feels like a good time for another analysis. We're quickly rolling up to NVDA's consequential earnings call with valuations running high on lots of popular stocks. The mania around SMCI also appears to be approaching a peak.
All investments come with significant risks, including the loss of all capital. Please do your own research before investing, and never risk more than you are willing to lose. I hold no certifications or registrations with any financial entity.
Let's dig into some data.
Why is breadth important?
Market breadth gives you an idea of how much of the market is participating in a rally or a downturn. Sometimes the big indexes, like SPX, will look great on a chart, but then you come to realize that the vast majority of the other stocks in the index aren't doing well.
Ideally, I'd like to see as many stocks in an index participating in the rally as possible. Rallies begin to look a little questionable to me when I see a small subset of stocks rallying while the remainder are floundering.
There are lots of ways to measure breadth, so let's get to it.
My breadth chart
I like to compare the readings from a couple of different indicators:
- McClellan Oscillator and Summation Index: These show different measurements of breadth over time. The summation index is the one with large, wide green hills in the weekly chart below. It keeps a running tally of advancing and declining stocks within the NYSE. The oscillator is a point-in-time measurement of where the summation index is heading.
- Stocks over 50 and 200 day moving averages: This is in the bottom of my chart below and it plots the number of stocks in the market (the whole market) that are above their 50 and 200 day moving averages. The yellow line marks the stocks over their 50MA and the red one is for the 200MA.
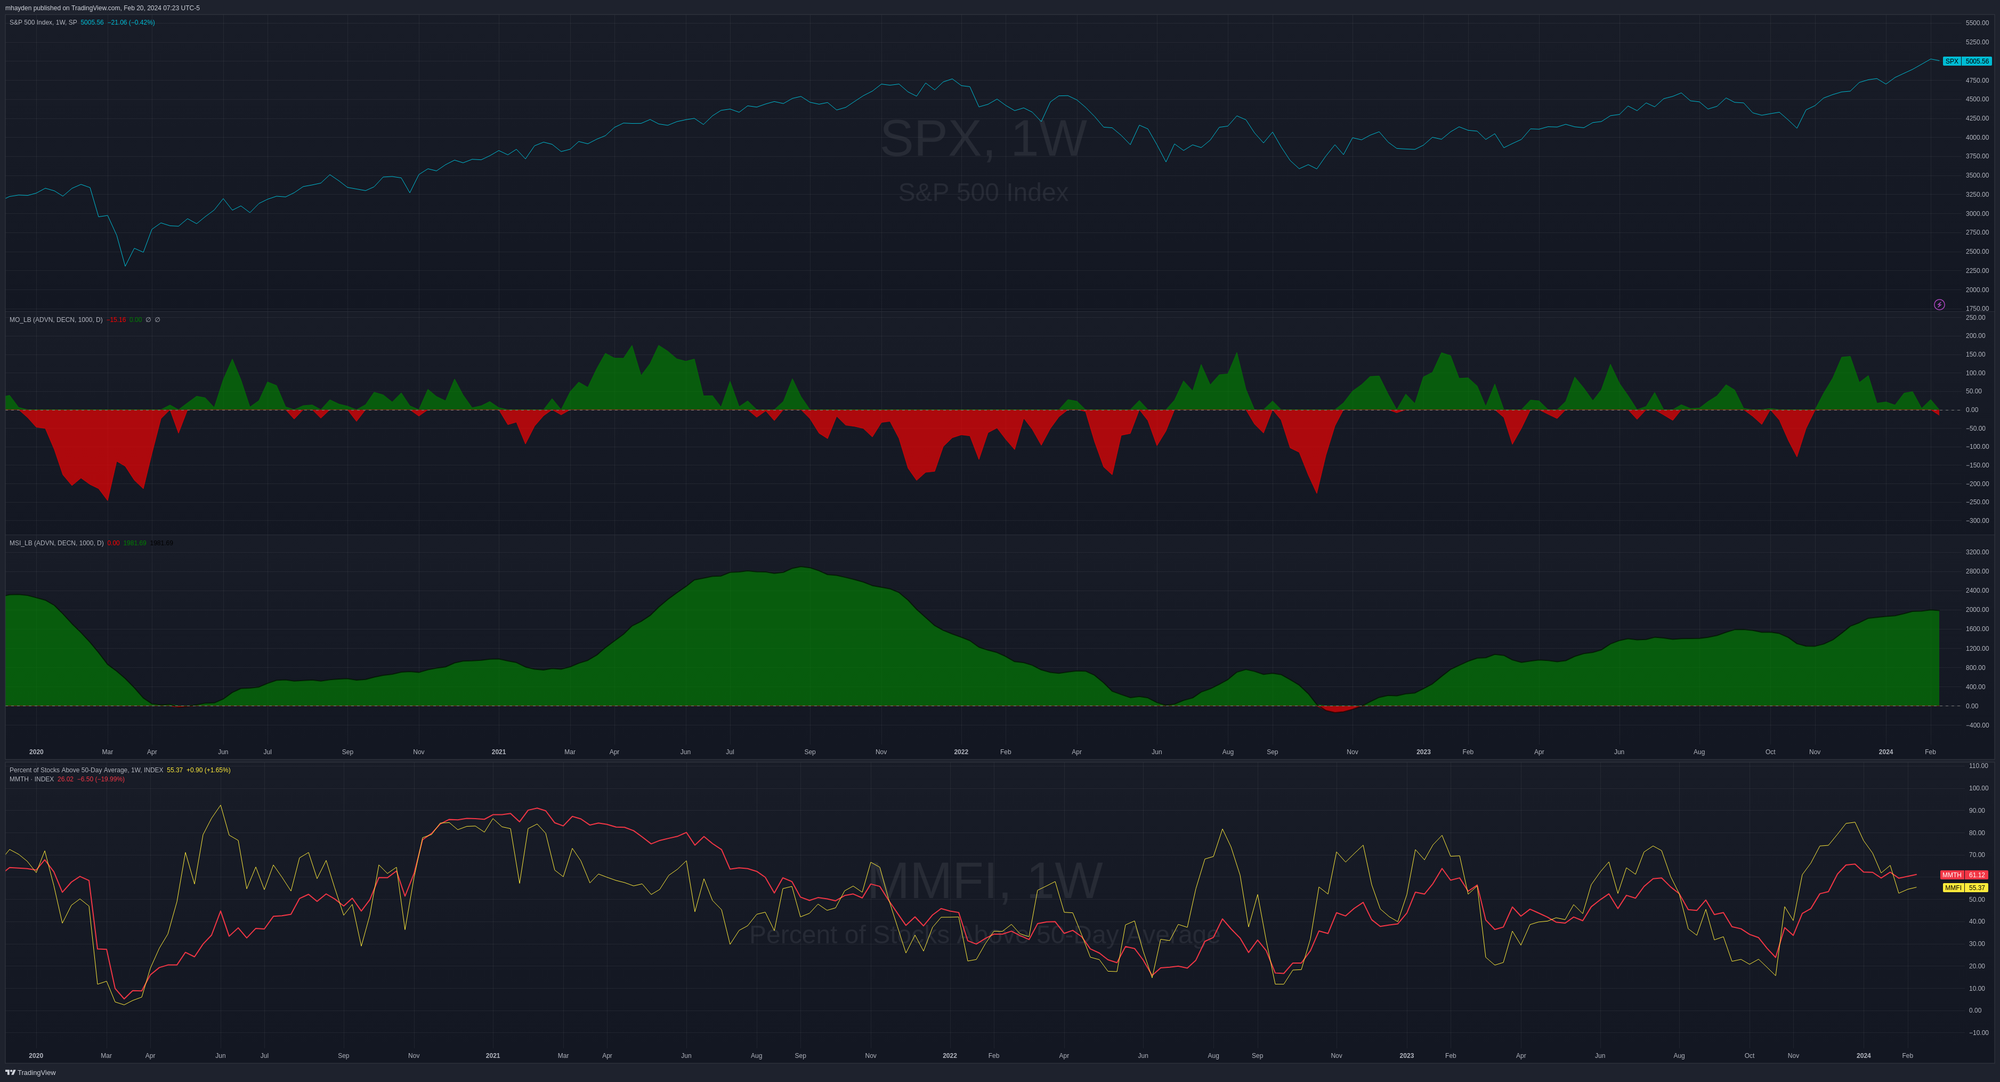
This weekly chart shows the summation index (third pane from the top) in a very positive area, but the oscillator shows that recent moves are relatively flat. This points to breadth that isn't moving much lately. This isn't bullish or bearish at first glance, but it's a sign that breadth isn't expanding or contracting significantly during the recent rally since Christmas.
The bottom chart shows that stocks over their 50 day moving average peaked right around December 25th of last year and moved below the 200MA line this year. We're in a situation where 55% of stocks in the market are over their 50MA while 61% are over their 200MA.
This divergence of SPX prices increasing with breadth holding fairly steady is the real tell.
This could be a situation where most stocks are cooling off for the next rally, or it could be a sign of a blow-off top on SPX. Breadth improved a lot until Christmas and then it slowed.
Equal weight SPX
As you likely know by know, the S&P 500 index is market cap weighted. This means that the largest stocks in the S&P 500 make up a bigger portion of the index than other stocks. MSFT and AAPL are highly over-represented in the index while another stock like MAR (Marriott Hotels) makes up a much smaller portion.
However, the equal weight SPX index (SPXEW on most platforms) and the RSP ETF can give us good comparisons to SPX and SPY. Here's a chart of SPX to SPXEW:
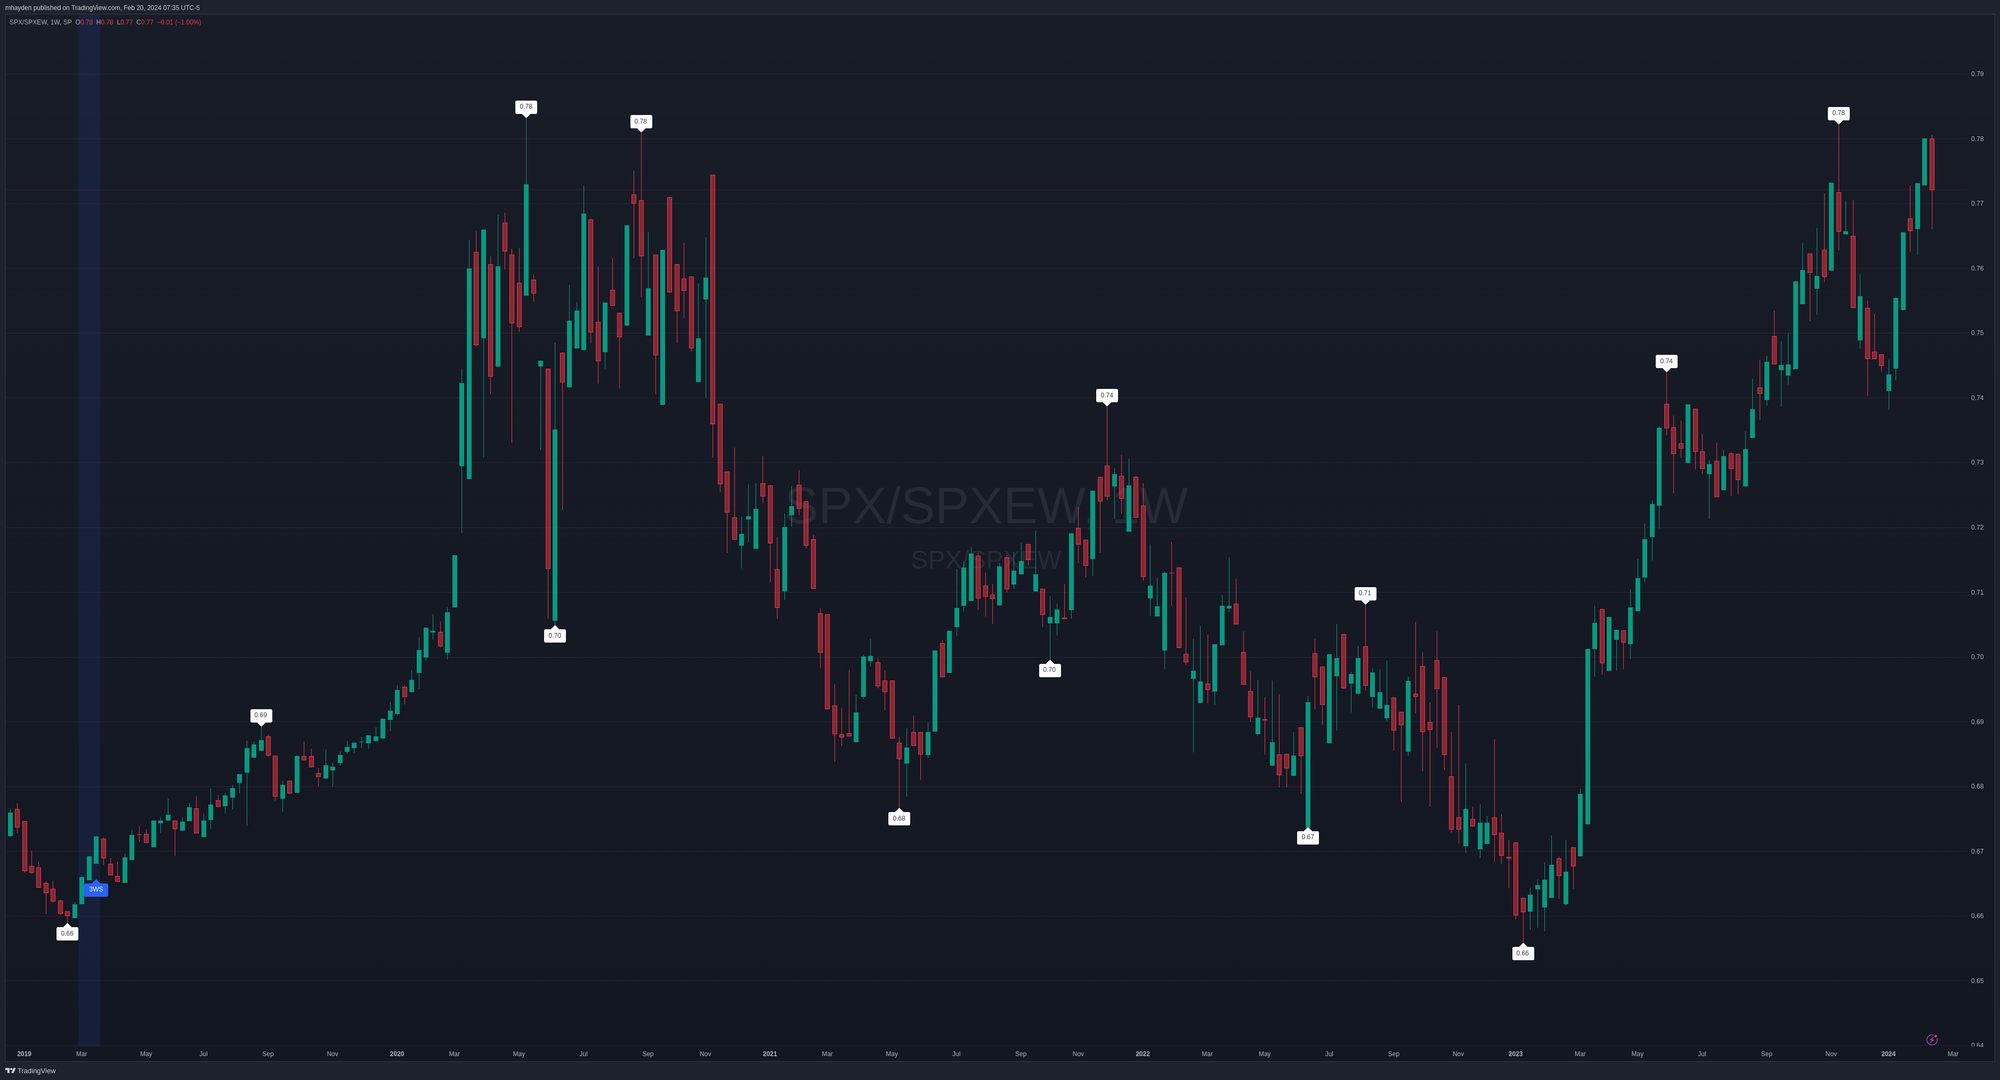
Here's how to read this chart:
- When the chart goes higher, it means that market-weight SPX is stronger than the equal weighted SPX index. This means that the top-end stocks in SPX are fueling more of the rally.
- When the chart moves lower, it means that market-weight SPX is weaker than the equal weighted SPX index. This is a sign that breadth is improving and more stocks are participating in the current move.
We're at a level now that we haven't seen since 2020 just after the pandemic drop. The market rejected off this level in November 2023 and then rallied back in early 2024 to the same level. Last week's price action looks like another rejection, but time will tell if that continues into this week.
On the upper side, a ratio of 0.78 looks to be our peak and 0.66 looks like the bottom. These have held well since the pandemic and might be good spots to mark on your charts.
Further reading and watching
Sometimes when I feel like I'm getting into a new spiral or beginning to worry too much, I seek out theses from other traders and investors. As usual, Chris Ciovacco's weekly videos are an excellent way to get a broad read on the market in less than a half hour:
He gives lots of tips on charts to watch for relatively strengths, especially bonds vs equities, defensive vs growth, and more. You can save these and track them on your own whenever you want.
But be sure to zoom out. Don't catch yourself stressing over a short term trend when the longer term trend is crystal clear. 😉
My trades
I'm still leaning bullish this week, but I'm trying to give myself a little more time for trades to be right by looking for DTE's around 45-60 days. I've been trading a lot of late March and April short puts lately and I still have some index hedges on through late summer.
I've decided to step back from SMCI for a while, too. It sure was a fun ride, but the risk looks much higher than the potential reward for my accounts. Watch your position sizes and always have a plan. 🤓
Good luck to everyone this week! 🍀
Discussion